Assignment: ROC Curve
Zahteve zaključka
Warm-up exercise
You won a lottery prize, you just don't yet know which. The probability that you'll get \$5 is 0.8 and the probability that you'll get $10 is 0.2. What is the expected value of the prize?
Assignment
Sara is a veterinarian who treats hamsters for Chomsky disease. About one half of hamsters she sees have this disease (luckily, the disease is not serious; it only makes hamsters run backwards on the running wheel).

She can make two kinds of mistakes:
• If she fails to detect the disease when it is present, the associated cost (lawsuits etc.) is \$1000.
• If she treats a hamster that is actually healthy, the cost (wasted treatment etc.) is $600.
(Don't worry about her, in both cases she charges enough to survive.)
Her choice whether to administer the cure will be based on the classifier that predicts the probability of the disease from the observed symptoms. The classifier she uses is not perfect, as shown in the ROC curve.
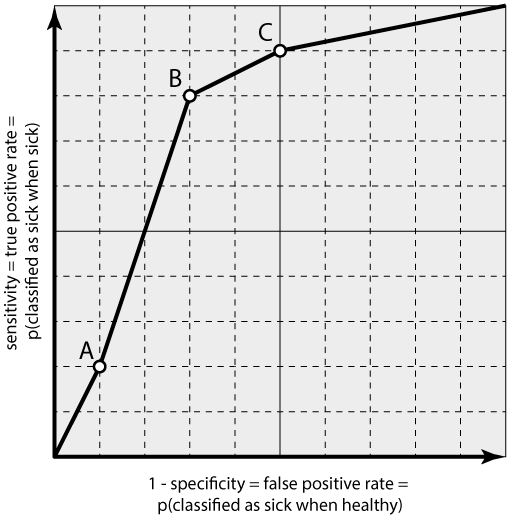
1. What is the false positive rate of each point marked on the ROC curve?
2. What is the true positive rate of each point?
3. How do you compute false negative rate from one of these two?
4. Each of the two kinds of Sara's mistakes is associated with one of the above three probabilities. For each kind, which is the associated probability?
5. What is the expected cost of mistakes for each point on the ROC curve?
6. Sara has accidentally put a sick and a healthy subject (that is, hamster) in the same cage. Now she doesn't know which is which. She is going to diagnose both hamsters and administer the cure to the one which she believes is more likely to be sick. What is the probability that she'll pick the wrong one?
Now take the heart-disease data. Use Naive Bayes with Test & Score. Observe probabilities in a Data Table. Say the cost of sending a healthy patient for further tests costs is 500\$ (insurance lawsuit) and the cost of not sending a sick patient for further tests is 800$ (patient lawsuit).
1. Send the first 50 patients that are the most likely to be sick for tests. What is the cost of lawsuits? What if you send the first 100 patients for tests. What is the cost of lawsuits now?
To select a specific number of instances, connect Data Table to Data Info. It will display the current selection size. Then, use Box Plot with Data output from the Data Table to inspect the ratio (group by Selected and inspect Diameter Narrowing). Which option is better, the one with 50 or the one with 100 patients?
2. Now evaluate Tree and Naive Bayes with Test & Score and export the data to .csv with Save Data. Use your preferred software to find the optimal number of patients that you should send for further tests (how many patients I should send for tests so that my costs are the lowest). Which model would you use in practice? Try drawing a curve showing the costs of lawsuits vs the number patients sent for tests.
Zadnja sprememba: ponedeljek, 14. marec 2022, 11.15